Quorbenic Stack Trace Merge Watcher: Cleaner Error Grouping for Complex Software Teams
Quorbenic Stack Trace Merge Watcher is built for one of the most frustrating parts of modern debugging: too many errors that look separate, even when they come from the same root problem.
In a small app, a stack trace is usually enough. You see the exception, check the function path, open the file, and start fixing. In a larger system, that process gets harder. One bug can show up across several services, workers, queues, API routes, and frontend sessions. Each layer may produce a slightly different trace, even though the real failure started in one place.
Quorbenic helps teams cut through that noise. It watches incoming stack traces, compares them by structure and context, merges related failures, and turns scattered errors into clearer issue groups.
The result is a cleaner debugging workflow: fewer duplicate alerts, better root-cause visibility, and less time wasted sorting through repeated traces.
What Quorbenic Stack Trace Merge Watcher Does
Quorbenic is an error intelligence layer for stack trace grouping.
It collects stack traces from application logs, runtime exceptions, distributed traces, background jobs, CI failures, and service-level monitoring tools. Then it analyzes each trace as structured data instead of treating it as a plain text block.
That distinction matters.
A raw stack trace tells you what happened in one moment. Quorbenic looks across many traces to answer a better question:
Which failures belong together?
To do that, it reviews exception type, top application frame, repeated call paths, service name, endpoint, deployment version, trace ID, timestamp, and other metadata. When different traces share the same failure shape, Quorbenic merges them into one watch group.
Instead of flooding developers with hundreds of similar errors, it shows one organized issue with useful details: frequency, affected services, first seen, last seen, version impact, and representative traces.
Why Stack Trace Merging Matters
Error monitoring tools are useful, but they can become noisy fast.
A single database timeout might create an API error, a worker failure, a retry exception, and a frontend alert. Without smart grouping, those can appear as four separate problems. Developers then spend time checking each one, only to discover they all point back to the same broken dependency.
Quorbenic reduces that wasted effort by linking related traces before they reach the triage queue.
This is especially useful in systems with:
- microservices
- background jobs
- serverless functions
- frequent deployments
- multiple programming languages
- third-party API dependencies
- distributed tracing
- high-volume production traffic
In these environments, the challenge is not just collecting errors. Most teams already collect plenty of them. The real challenge is finding the signal inside the noise.
What Makes Quorbenic Different
Most error grouping starts with a fingerprint. That fingerprint may be based on exception type, message, stack frames, or the topmost application frame.
Quorbenic goes further by using layered trace comparison.
Instead of relying on one grouping clue, it scores traces across several dimensions:
- Frame similarity: Do the important application frames match?
- Exception shape: Is the same error type appearing in a related path?
- Service context: Did the error come from the same service, route, worker, or job?
- Causal timing: Did one failure trigger another within the same request window?
- Deployment awareness: Did the pattern start, change, or disappear after a release?
- Trace relationship: Do related spans, request IDs, or correlation IDs connect the failures?
This gives Quorbenic a more flexible grouping model. It can avoid two common problems: grouping unrelated errors too loosely, or splitting the same bug into too many separate issues.
The goal is not to hide details. The goal is to group intelligently while still letting developers split, merge, pin, or adjust issue groups when needed.
How Quorbenic Processes a Stack Trace
When Quorbenic receives a stack trace, it first breaks the trace into frames. Each frame can include a function name, file path, module, class, package, line number, runtime marker, or service label.
Then it normalizes the trace.
That means it filters out details that often change without changing the actual bug. Examples include temporary build paths, generated folder names, memory addresses, changing line numbers, request IDs, and wrapper functions added by frameworks or instrumentation tools.
After that, Quorbenic identifies the most meaningful application frames. These are usually the frames closest to the source of the bug, not the framework or runtime code surrounding it.
Once the trace has been cleaned and scored, Quorbenic compares it against existing watch groups. If the trace matches a known pattern, it joins that group. If it is meaningfully different, Quorbenic opens a new group.
This creates a more useful error dashboard. Developers see fewer duplicate issues and more context around the failures that actually matter.
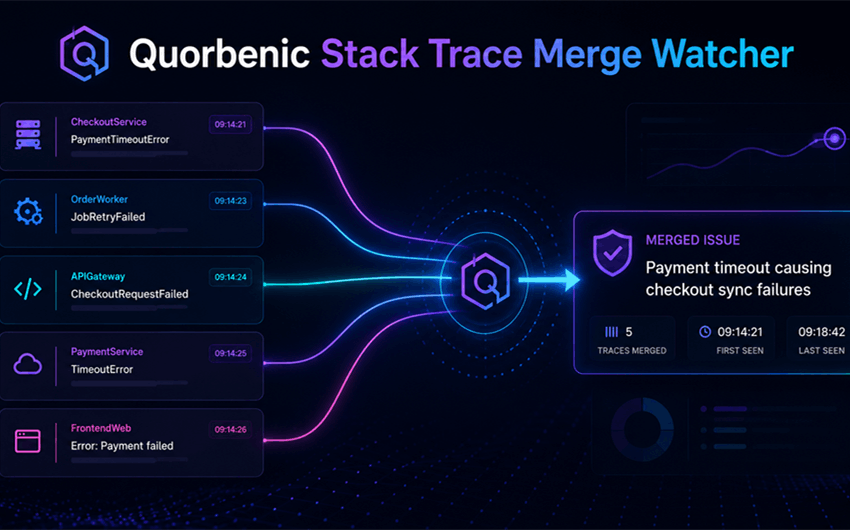
A Simple Example
Imagine a checkout service throws this error:
PaymentTimeoutError at checkout/payment_client.py:188
A few seconds later, a worker logs:
JobRetryFailed at jobs/order_sync.py:74
Then the API gateway records:
CheckoutRequestFailed at routes/checkout.py:41
A basic monitoring setup might treat these as three different problems.
Quorbenic looks at the surrounding context. The traces share the same request ID, occurred in the same time window, and connect back to the payment client timeout. Instead of opening three unrelated alerts, Quorbenic links them under one issue group:
Payment timeout causing checkout sync failures
That gives the engineering team a clearer starting point. They can focus on the payment dependency instead of chasing symptoms across the stack.
Core Features
Trace Fingerprint Scoring
Quorbenic creates a trace fingerprint from the most meaningful parts of an error. It weighs the exception type, top application frame, normalized call path, service context, and message pattern.
This makes grouping more accurate than simple text matching. Two traces can be linked even if small details change between environments or deployments.
Cross-Service Correlation
Quorbenic can connect related errors across services when they share trace IDs, request metadata, dependency paths, timing patterns, or downstream failure behavior.
This is useful when one service creates a chain reaction. Instead of making every service look guilty, Quorbenic helps show which failure came first and which errors followed.
Duplicate Alert Suppression
Repeated traces should not create repeated noise.
Quorbenic collapses duplicate stack traces into one issue group while still tracking volume. Teams can see whether an error happened five times or five thousand times without receiving five thousand alerts.
Version-Aware Grouping
A deployment can change stack traces without changing the underlying bug. Line numbers move. Files are bundled differently. Function wrappers shift.
Quorbenic tracks issue groups across versions so teams can see whether an error is new, recurring, fixed, or resurfacing after a release.
This is especially helpful during incident response. Developers can quickly check whether a spike began after a specific deployment.
Root Frame Highlighting
Long stack traces often include many frames that are not useful for diagnosis.
Quorbenic highlights the most relevant application frames and de-emphasizes framework, runtime, dependency, and instrumentation noise. This helps developers move from alert to likely source faster.
Watch Rules
Teams can define watch rules for high-priority failure patterns.
For example, a team might watch for payment failures, authentication crashes, database timeouts, memory errors, queue retry failures, or frontend exceptions tied to backend changes.
When a watched pattern increases, crosses a threshold, or appears after a deployment, Quorbenic can raise a focused alert.
Where Quorbenic Fits
Quorbenic does not replace logs, tracing, APM, or error monitoring. It improves the layer between raw error data and human investigation.
A typical setup might look like this:
Application services send logs, exceptions, and trace data into the observability stack. Quorbenic receives the error signals, normalizes the stack traces, groups related failures, and sends cleaner issue groups to the team’s dashboard or alerting system.
That makes it useful as a companion to existing monitoring tools rather than a full replacement.
Who It Is For
Quorbenic is best suited for engineering teams that already have enough error data but struggle to organize it.
It is especially useful for SaaS platforms, API-heavy products, microservice teams, DevOps groups, and applications with frequent releases.
A small project with one service and low traffic may not need this level of grouping. Basic logs and standard error monitoring may be enough.
But once a team starts seeing repeated traces, noisy alerts, cross-service failures, and unclear incident ownership, a stack trace merge watcher becomes valuable.
Benefits for Engineering Teams
The biggest benefit is faster triage.
Developers do not have to inspect every repeated error manually. Quorbenic groups related traces, highlights the important frames, and shows how the problem is spreading.
It also improves alert quality. Instead of alerting on every duplicate trace, teams can alert on meaningful issue groups, growth rate, affected versions, or impacted services.
Over time, this creates a cleaner production debugging process. Teams spend less time sorting errors and more time fixing the causes behind them.
Limitations
Quorbenic depends on good error data.
If services do not send stack traces, exception types, timestamps, service names, deployment versions, or trace IDs, grouping will be less accurate.
It also needs sensible rules. If grouping is too aggressive, unrelated errors may be merged. If it is too strict, the same bug may appear as several separate issues.
That is why Quorbenic works best when automation and developer control are combined. The system should suggest smart grouping, but engineers should be able to split, merge, ignore, or pin groups when needed.
Final Takeaway
Quorbenic Stack Trace Merge Watcher gives teams a smarter way to manage error noise.
It does not just collect stack traces. It compares them, cleans them, links related failures, suppresses duplicates, and turns scattered exceptions into focused issue groups.
For teams running complex services, frequent deployments, queues, APIs, and distributed systems, that difference matters.
Raw stack traces show where errors appeared. Quorbenic helps show which errors are connected — and which one deserves attention first.